Study Logic

Study Logic.

How a probability study is defined, filtered, measured, and reported. This page is for readers who want the function logic behind the research, not just the result.

Pipeline

From raw bars to a published probability.

Every study follows the same sequence. First define the event. Then qualify it with filters. Then measure the outcome inside a fixed forward window. Finally aggregate the observations into probability, expectancy, and distribution statistics.

01

Define Event

Specify the session, trigger, context, and time window.

02

Define Conditions

Declare the structural rules that qualify the event.

03

Filter Data

Apply data quality, session, and exclusion filters.

04

Compute Outcome

Measure whether the target, stop, or other endpoint occurs.

05

Validate Sample

Check counts, contamination risk, and rule compliance.

06

Report Results

Summarize probability, expectancy, and limitations.

Function Structure

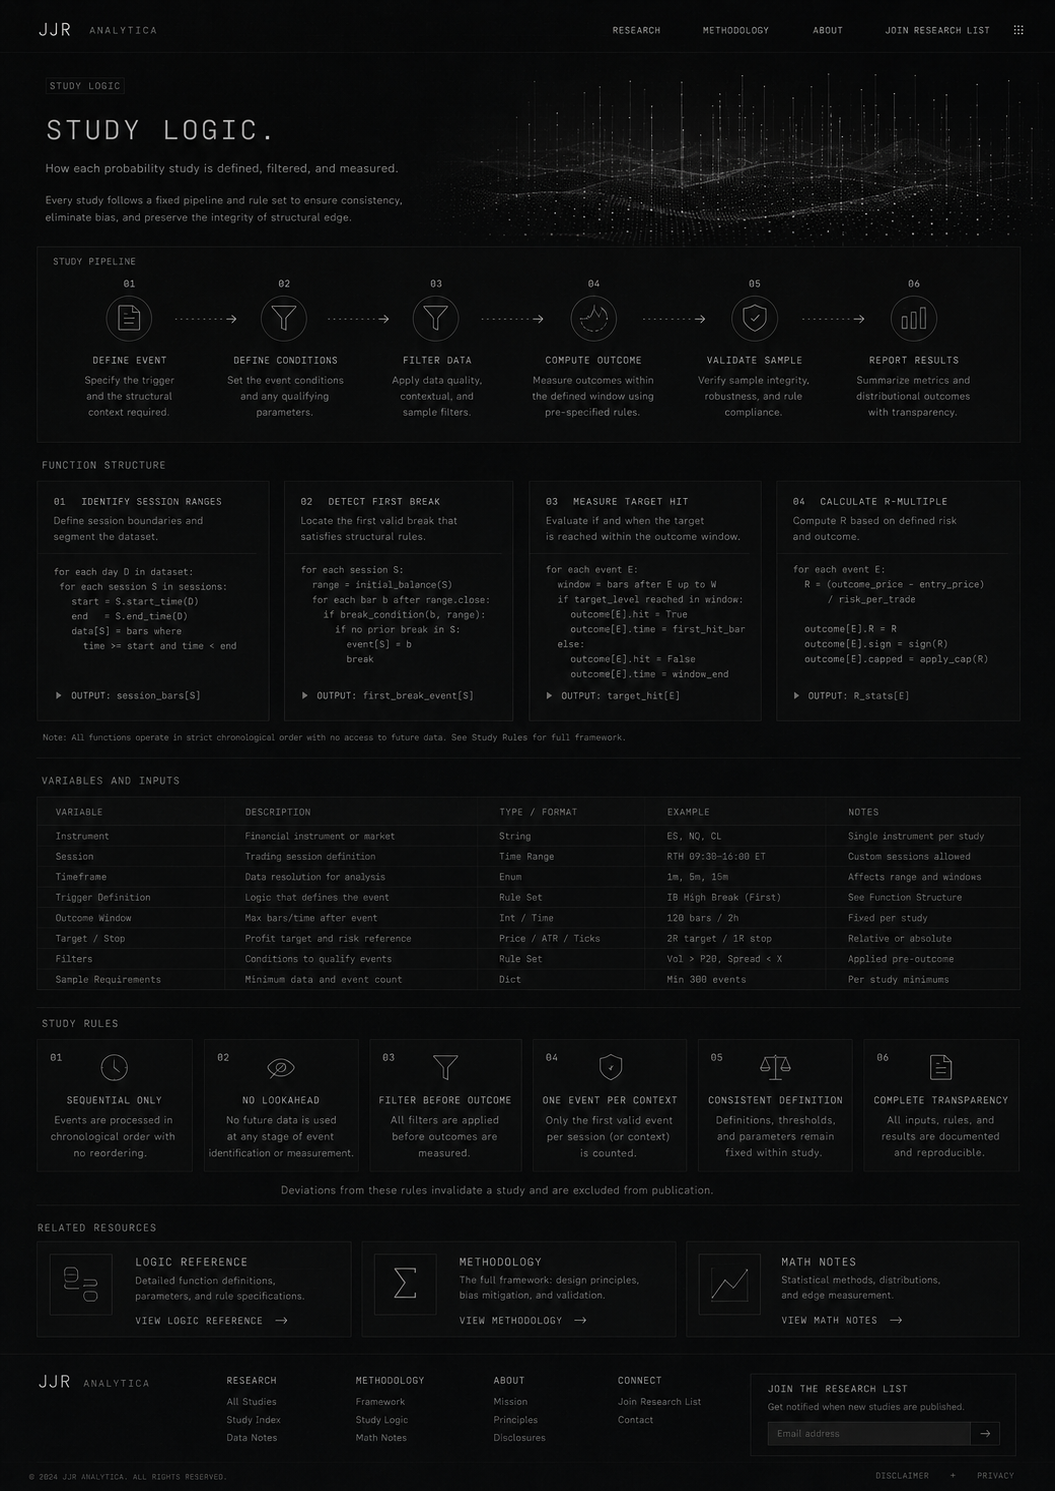
01 Identify Session Ranges

Define session boundaries and segment the dataset.

for each day D in dataset:
  for each session S in sessions:
    start = session_start(D, S)
    end   = session_end(D, S)
    bars[S] = bars where time >= start and time < end
Output: session_bars[S]

02 Detect First Break

Locate the first valid break satisfying the structural rules.

for each session S:
  ib = initial_balance(S)
  for each bar b after ib window:
    if break_condition(b, ib):
      first_break = b
      break
Output: first_break_event[S]

03 Measure Target Hit

Evaluate if and when the target is reached inside the outcome window.

for each event E:
  window = bars after E up to W
  if target_level reached in window:
    outcome[E].hit = True
    outcome[E].time = first_hit_bar
  else:
    outcome[E].hit = False
Output: target_hit[E]

04 Calculate R-Multiple

Convert the outcome into a normalized risk unit.

for each event E:
  R = (outcome_price - entry_price)
      / risk_per_trade
  outcome[E].R = R
  outcome[E].sign = sign(R)
Output: R_stats[E]
Variables and Inputs
VariableDescriptionType / FormatExampleNotes
InstrumentFinancial instrument under studyStringES, NQ, MNQOne instrument per study
SessionTrading session definitionTime RangeRTH 09:30–16:00 ETMust be fixed within a study
TimeframeBar resolution for analysisEnum1m, 5m, 30sAffects sensitivity
Trigger DefinitionLogic that defines the eventRule SetIB High Break FirstSee Study Rules
Outcome WindowMax forward bars/time after eventInteger / Time120 bars / 2hFixed per study
Target / StopProfit target and risk referencePrice / ATR / Ticks2R target / 1R stopRelative or absolute
FiltersQualifying rulesRule SetVolume > X, Spread < YApplied before outcome
Sample RequirementsMinimum event countInteger≥ 300 eventsPer-study threshold
Study Rules

Sequential Only

Events are processed in chronological order with no reordering.

No Lookahead

No future data is used at any stage of identification or measurement.

Filter Before Outcome

All qualifying filters are applied before outcomes are measured.

One Event Per Context

Only the first valid event per session or context is counted.

Consistent Definition

Definitions and parameters remain fixed within a study.

Complete Transparency

Inputs, rules, and limitations are documented and reproducible.

Related Resources

Methodology

The high-level research framework, bias controls, and publishing standards.

View Methodology →

Math Notes

The probability, expectancy, and confidence interval math behind each result.

View Math Notes →

Walkthrough

A page that shows a single study being built step by step.

View Walkthrough →
Educational research only. Not financial advice.