Conditional Probability
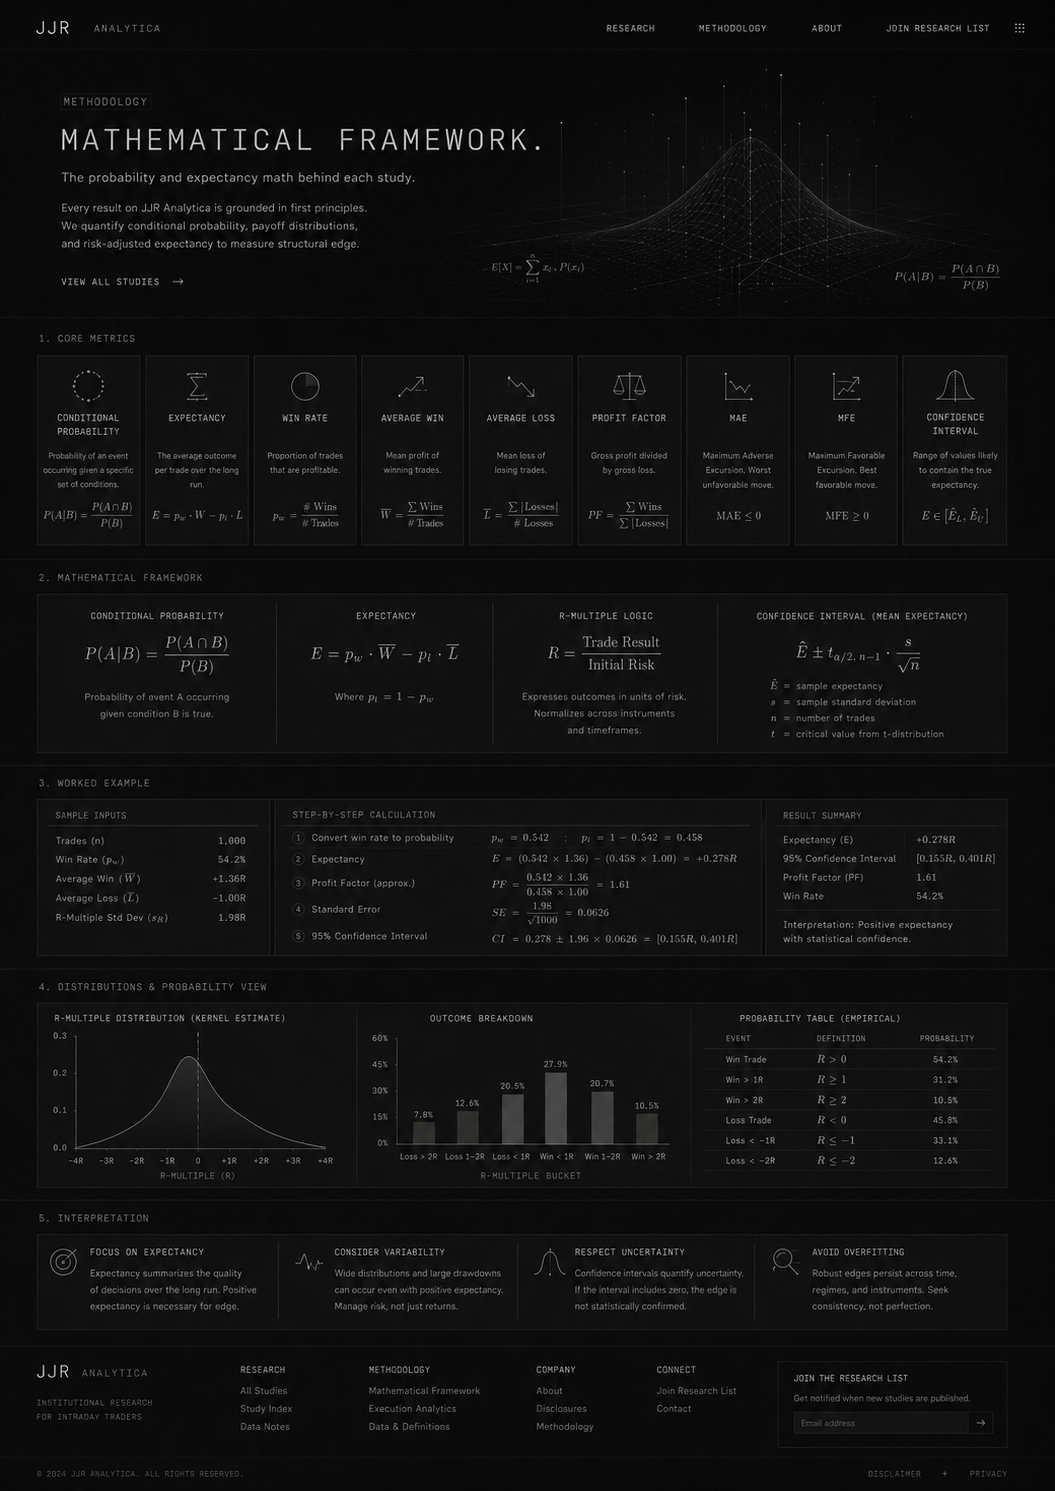
P(A|B) = P(A ∩ B) / P(B)
Use this when a study asks a question like: probability the RTH breaks IB High, given Low Forms First.
This page explains the probability and expectancy math behind each study. It is meant to bridge the result page and the implementation logic.
Probability of event A occurring given condition B is true.
Average outcome per trade or event over the long run.
Proportion of observed events that end favorably.
Mean profit of winning outcomes.
Mean loss magnitude of losing outcomes.
Gross profit divided by gross loss.
Maximum adverse excursion, worst open excursion during the trade.
Maximum favorable excursion, best open excursion during the trade.
Range of values likely to contain the true mean expectancy.
Use this when a study asks a question like: probability the RTH breaks IB High, given Low Forms First.
A positive probability alone is not enough. The payoff profile matters.
Normalizes outcomes into risk units so studies are comparable across instruments.
Frames the uncertainty of the sample estimate rather than pretending the result is exact.
Trades (n): 1,000
Win Rate (pw): 54.2%
Average Win (W̄): +1.36R
Average Loss (L̄): −1.00R
R-Multiple Std Dev (s): 1.98R
1) Convert win rate to probability
   p_w = 0.542
   p_l = 1 - 0.542 = 0.458

2) Expectancy
   E = (0.542 × 1.36) - (0.458 × 1.00)
   E = 0.73712 - 0.458 = +0.27912R

3) Profit Factor
   PF = 0.542 × 1.36 / 0.458 × 1.00 ≈ 1.61

4) Standard Error
   SE = s / √n = 1.98 / √1000 ≈ 0.0626

5) 95% Confidence Interval (approx.)
   CI = 0.279 ± 1.96 × 0.0626
   CI ≈ [0.156R, 0.402R]
| Result Summary | Value |
|---|---|
| Expectancy (E) | +0.279R |
| 95% Confidence Interval | [0.156R, 0.402R] |
| Profit Factor | 1.61 |
| Interpretation | Positive expectancy with statistical confidence |
A setup can have a moderate win rate and still be superior if the win/loss profile is favorable.
Large distributions and adverse excursions matter. Variability is part of the edge evaluation.
Robust edges should persist across time, context, and regime. Seek consistency, not perfection.