Raw Data
~2.4B rows/day raw feed, reduced into study-usable sessions after parsing and normalization.
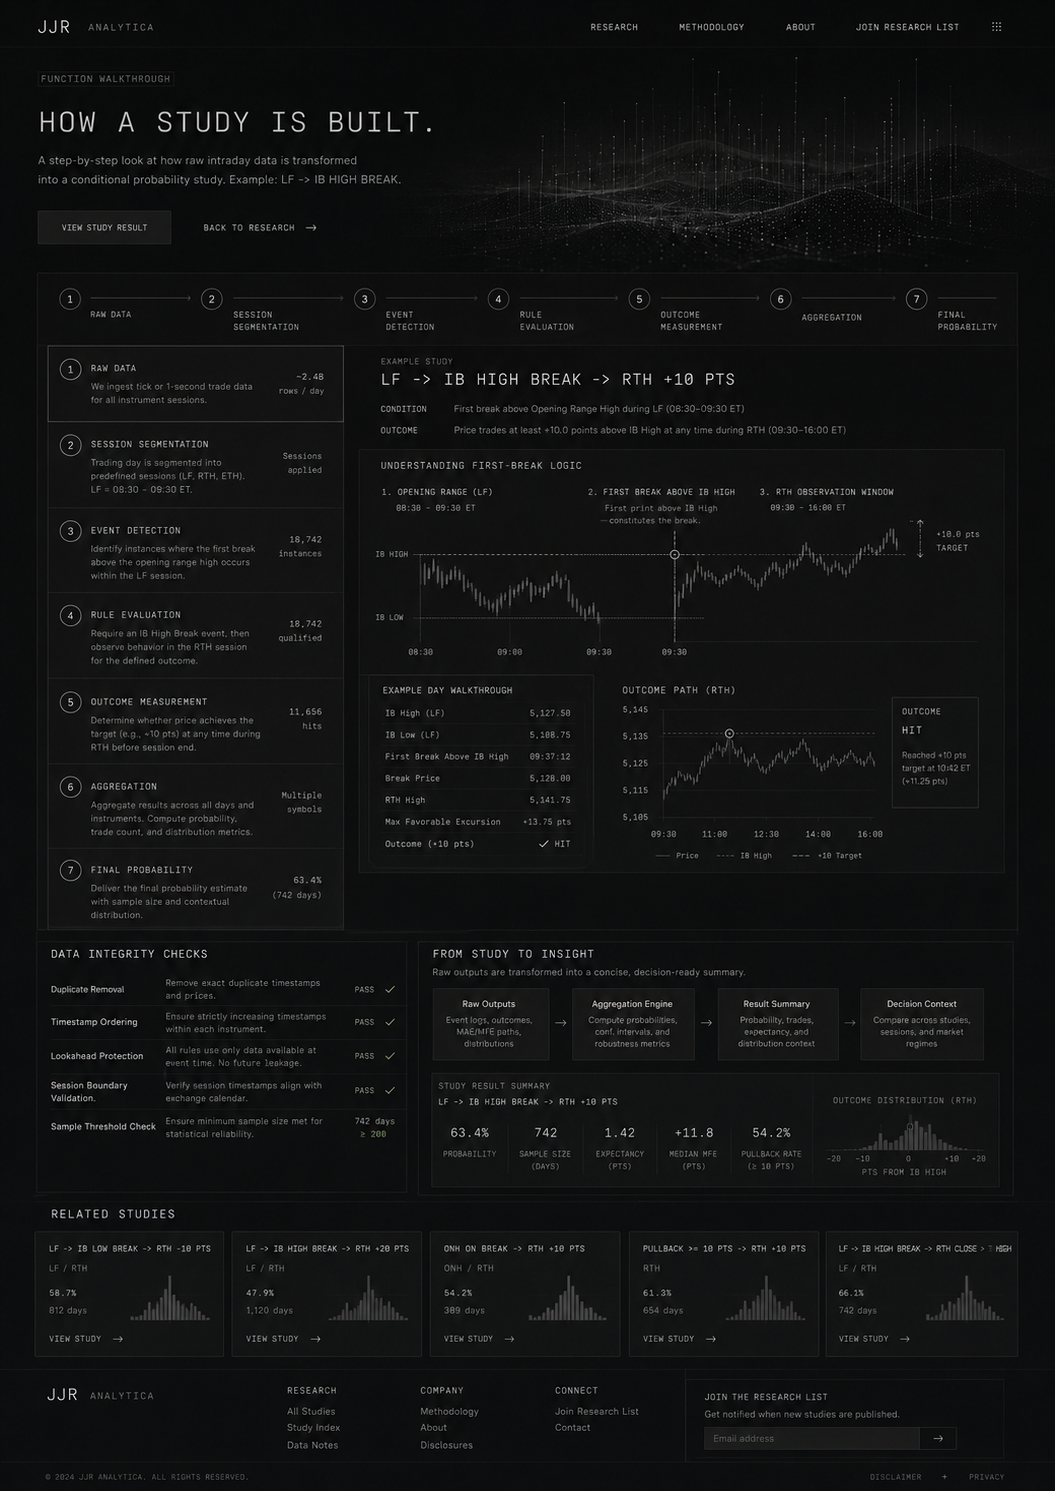
A step-by-step look at how raw intraday data becomes a conditional probability study. Example: LF → IB High Break.
Ingest tick, 1-second, or bar data for all sessions.
Split data by session and timezone rules.
Find the first break satisfying the event definition.
Apply context and qualifying filters.
Measure target, stop, and excursion behavior.
Compile all events into summary statistics.
Publish the study with counts and limitations.
LF → IB High Break → RTH +10 pts
Condition: first break above opening range high during a Low-First session.
Outcome: price trades at least +10.0 points above IB High at any time during RTH.
| Probability | 63.4% |
| Sample Size | 742 days |
| Expectancy | +1.42 pts |
| Median MFE | +11.8 pts |
| Pullback Rate (≥ 10 pts) | 54.2% |
~2.4B rows/day raw feed, reduced into study-usable sessions after parsing and normalization.
Trading day segmented into LF, RTH, and ETH windows based on a fixed exchange calendar.
Identify instances where the first valid break above the IB High occurs within the LF session.
Require the event to occur within the study window and reject duplicates or invalid timing.
Track whether price reaches +10 pts above IB High before the RTH session ends.
Aggregate across all valid sessions and compute probability, distribution, and R-results.
| Check | Purpose | Status |
|---|---|---|
| Duplicate Removal | Remove exact duplicate timestamps and prices. | Pass |
| Timestamp Ordering | Ensure strict chronological order within each instrument. | Pass |
| Lookahead Protection | All rules use only data available at event time. | Pass |
| Session Boundary Validation | Verify session windows align with exchange calendar. | Pass |
| Sample Threshold Check | Ensure minimum event count for reliability. | 742 days ≥ 200 |
Event logs, outcomes, MAE/MFE paths, distributions.
Compute probabilities, confidence intervals, and robustness metrics.
Present the concise probability, expectancy, and context.
Compare across studies, sessions, and regimes.